gbp/usd update 7-21-08
Click to enlarge
Gbp/usd 7-21 08
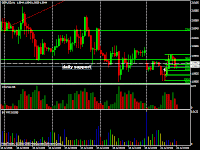
Okay, the market closed down on the 1hr bar that closed at 9:00 am est. closed below daily support and 38% fib.
We now need to draw our intraday fib level to go with the daily fib level. The intraday fib is drawn inside the daily fib from the last intraday low to the last intraday high.
When we do this we can see that the last 1hr bar, even though a down bar, had lower volume that the previous 1hr bar.
So, this 1hr down move has not shown strength and therefore is not bearish to the 4hr bullish setup yet. So, far we have no trigger for a trade. Remember, Archimedes has shown us that a market can be falling and yet still be displaying strength.
Bar marked 1 on the chart is the current 1hr footstep and we can expect the range of this bar to be challenged and those short sellers should start buying to cover their positions which should provide a bounce up off intraday 61 or 78.6% fib.
The market is really waiting for the U.S. news data to come out at 10:00 am est. And it is typical for markets to go the other way to suck you in the wrong direction before the news comes out.
By the way, the current 4hr setup that we are looking at is an outside bar on higher volume. Until the market breaks below the low of the last 4hr bar the setup is still in effect.
AT the close of this bar I will be looking for an up close on lower volume to signal that selling pressure has been exhausted.
Always be suspicious when you see a long range bar as we had on the last hour but that last hour had lower volume.
There’s not enough time to say all I want as usual because I want to get this to you before the market moves. The setup at the close of this current bar at 10:00 am est just before the news will give a good indication as to which way price will go from here.
NOTE: If you were trading the Fibonacci technique outlined in the CHARTS AND MEN VIDEOS you would already have been short at the high of today.
Cheers,Jerry


No comments:
Post a Comment