Thursday, July 24, 2008

gbp/usd update 7-24-08


click to enlarge


Let’s resume our gbp/usd tracking for a moment.

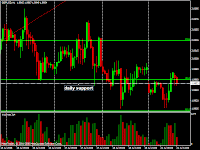
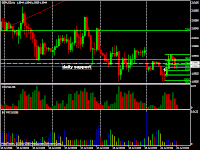
Today we can see that the 4hr gmt bar closed right above at 61% daily Fibonacci. So, we can assume that price will attempt to move up and challenge 50% daily fib at 9899. Why there? Because, That is the location of overhead price resistance as well as 50% fib resistance.

Both of these levels are untested after the breakdown through them. Most moves cannot be trusted to continue fully until the broken support or resistance level has been tested.

The 4hr trend is currently down so we would only be looking for opportunities to go short.

When price reaches our resistance area we don’t want to enter just because price touches that level. When price gets to resistance we want to drop down to our 1 hr chart and wait for the close of that 1hr bar to see if we have a setup. It is only then that we look for an entry trigger.

As I write this we are currently at 23% fib resistance where we can normally expect a pause and this is the first level we must close above before we can make it to the price resistance level of 9899.

You must not enter on the touch of resistance especially in this case because the 2 bars ago we closed with a long range down bar and it was a public.

You can best believe that operators are going to at least attempt to fade this bar up to near the high of that public and the high of that bar is a 61% fib resistance of the last down swing.

So, when we look at our 1hr we currently see the market is trying to form a bull pivot reversal. We won’t know until the end of this current hour.

We want to see this bar close higher than the high of the last bar (9849)
With higher volume than the previous 1hr bar or strong professional/operator participation.

If that should happen we will have a bullish 1hr setup. We would then look for our trigger which will be a pullback to 61% Fibonacci (9841) where we would enter long. This would be a counter trend entry so the risk on this one would be enhanced more than if we are entering with the trend.

If we get our trigger we would look to take profits at 9900 (50% daily fib resistance).

Our stop would go 6 to 11 pips below 61% fib and the low of the day ( 9815)or on 1hr weakness after entry even if stop is not hit. These are composite support for the moment.

So, no setup means not entry. No trigger means no entry. These are safety guidelines to keep your risk small.

Cheers, Jerry
jerry@foretradingmajic.com
tradingmajic1@gmail.com

BUILDING SMALL ACCOUNTS WITH MONEY MANAGEMENT

MONEY MANAGEMENT FOR MINI ACCOUNT DAYTRADERS

This article is a reprint of an article I wrote a while ago while keeping statistics on trade call I was making at the time. I am posting it here as there are many new members to THE LAWS OF CHARTS AND MEN who can benefit from some suggestions made here.

I have touched with you a little on trade management. There is something that goes hand in hand with trade management and that is money management.

When you look at the trade results I posted you may think that you can’t do a lot with that trading a mini account. Well, let’s see.

We will use our last 5 live trade calls and add contracts to each winning trade and subtract an equal number of contracts from losing trades.

In the end, you will see how a realistic profit of 1700 pips can be gained over a one month period, while risking only $16 dollars of your initial account balance, with an average winning trade of 23 pips.

This is the true power of LCM. The power to keep your risk/stops small while still providing a very high win rate.

1ct X +25 pips + 25 pips

2ct X+22 pips + 44 pips

3ct X+ 43 pips + 129 pips

4ct X+23 pips + 92 pips

5ct x+7 pips + 35 pips

TOTAL 325 PIPS


STOP INITIAL CAPITAL RISKED

1. 16 PIPS 16 PIPS
2. 20 PIPS 0 YOUR NEXT STOP IS WITH HOUSE MONEY
3. 23 PIPS 0 YOUR NEXT STOP IS WITH HOUSE MONEY
4. 36 PIPS 0 YOUR NEXT STOP IS WITH HOUSE MONEY
5. 38 PIPS 0 YOUR NEXT STOP IS WITH HOUSE MONEY

NOW YOU HAVE EARNED 325 PIPS WHILE RISKING ONLY 16 PIPS OF YOUR INITIAL INVESTMENT…OR DOUBLED A $300 MINI ACCOUNT.

THEN, ON YOUR NEXT CYCLE OF TRADES YOU CAN START WITH 2 CTS INSTEAD OF 1 AND ADD 2 ADDITIONAL CONTRACTS AFTER EACH WINNING TRADE AND IT WOULD LOOK LIKE THIS;

2ct X +25 pips + 50 pips

4ct X+22 pips + 88 pips

6ct X+ 43 pips + 258 pips

8ct X+23 pips + 184

10ct x+7 pips + 350 pips

TOTAL 930 PIPS + 325 PIPS ON FIRST CYCLE = 1255 PIPS

THIS IS NOT AS FAR FECTHED AS IT SOUNDS BECAUSE LCM CAN ACCOMPLISH 10 WINS IN A ROW OVER A 2 WEEK PERIOD INTRADAY.
SO NOW WE GO INTO A 3RD WEEK OR CYCLE OF 5 TRADES


NEXT CYCLE START WITH 3 AND ADD 3 TO EACH WINNING TRADE

3ct X +25 pips + 75 pips

6ct X+22 pips + 132 pips

9ct X+ 43 pips + 387 pips

12ct X+23 pips + 276

15ct x+7 pips + 105 pips

TOTAL 930 PIPS
+ 1255 PIPS ON FIRST 2 CYCLES = 2185 PIPS


Now To the 4th or End Of the Month Cycle
Start With 3 and Add 3 to Each Winning Trade

4ct X +25 pips + 100 pips

You get the Idea.

Cheers,Jerry

jerry@forextradingmajic.com

tradingmajic1@gmail.com

Tuesday, July 22, 2008

video update gbp/usd


click chart to watch video


Here is a video update to give you some more trading ideas.


JERRY
JERRY@FOREXTRADINGMAJIC.COM
TRADINGMAJIC1@GMAIL.COM

THINKING LIKE THE HERD

DO YOU HAVE YOUR BEARINGS?
ARE YOU A COUNTER INTUITIVE THINKER?


I know I was annoying yesterday with all those emails to you but how else can I show you in real time what works and what does not. But today won’t be a annoying; you need time to digest “TRUTH”, so today I will just try to cook up a little food for thought cause trading is not just about numbers and lines, it is a way of thinking. And the truth is this…everything you already know does work BUT, only when integrated into the whole.

Any technique you are using as your primary technique you need to know how it fits into the scheme of motion.

Why isn’t a biologist a doctor? A biologist knows all about the actions of cells but cannot heal you. A doctor knows less about cell biology but the doctor knows how to integrate cell biology into the whole of the body. Are you studying to be a cell biologist or are you studying to be a doctor?

If you are simply searching for a trading system you are studying to be a cellular biologist and when things don’t go as expected you won’t be able to heal your account. If you are studying to learn how to trade then, you are studying to be a trade doctor.

LOST BEARINGS

This has happened to me a few times in my life. I know it’s never happened to you because you are way too smart. But listen.

I’m at a party in an area I don’t know very well. A friend asked me to drop him off at his girlfriend’s house after a party. We hop in the car and I ask him where his girlfriend lives.

Friend, “Just go to the light and turn left.
Me, “What’s her address?
Friend, “Just make a right at the next corner
Me, “What’s her address?
Friend, “We’re almost there just make another left at the next light

After going through these directions all the way to his girlfriend’s house he got out we said our byes and I left. But only one problem…!

I got a few blocks from his girlfriend’s house and realized. I DON’T KNOW WHERE I AM. I’m lost. You see, I was focused on turning right and turning left per my friend’s instructions, that even though I drove to the destination I didn’t really know how I got there.

I HAD NO BEARING ON MY LOCATION…

If I had some bearing I could find my way home. I first needed to know if I was north, south, east or west of my home. Once I found out from a gas station attendant that I was east of my home it was a simple matter to just travel eastward until I could recognize where I was.

That’s what I try to do for you in your trading. Not just give you some trading techniques (turn left, turn right); I give you your bearings.

I am like you. No matter how much I think I know about trading I am always scouring for more information to add to what I know. I have spent thousands over the years on books, seminars, etc…

Even the very worst of these I found some value in. See, here is where most think differently than I do. I find the most value in information that will keep me out of bad trades. I look for information that will save me lost pips rather than information that will earn me pips.

If I know all the times that I should not trade, all that’s left is when I should. If it is a situation that does not say, “Stay out”, all that’s left is to get in. There is a sign on the door that says, “Do not enter”. If there is no sign that say’s do not enter, then it is okay to enter.

Don’t lose money and making money will take care of itself. You should not be trading to win. You should be trading not to lose. FLAT OUT…DEFENSE WINS CHAMPIONSHIPS…

Just like war, sports, or any competitive endeavor, in trading, defense wins.

I bought a particular book on trading some years ago that I thought was the worst trading book I ever saw. Later that week I was about to make a trade and something I read in that book caused me to pause and reconsider the trade. While I was reviewing the information the market shot up 250 pips against the position I was just about to enter.

One tiny piece of information contained in that book paid for that book four times over. That terrible book. So, this is where we may differ, on how we evaluate value. Most people do not because this type of thinking is counter intuitive, but that’s exactly the type of thinking you have to have in trading…COUNTER INTUITIVE.

Really the term counter intuitive just means, THINKING OPPOSITE OF THE HERD…

You will find it hard to only think counter intuitive only when it’s time to make a trade.
This type of thinking is a state of mind not a trading event.

Counter intuitiveness must be in play when you consider where you get your information, and how you get your information/education.

I’m not saying that you have to obtain the information I provide but I am saying that you should never stop buying books, courses, and as well as any free info you can find. Forever…as long as you consider yourself a trader.

So, if you want to save yourself a lot of time, and time is money, you need to start looking at your trading education like a college education. Tell me…each semester, how much do you pay for books? I have to spend several hundred for each of my daughters each semester just for books.

So, we are perfectly willing to spend 15-30,000 per year to go to college for 4 years and then hope that the economy is kind enough to give us a job that pays just enough to keep us in debt. HMMMM…

However, most traders think they can readily get the information they need to make a killing from trading all for free. I’m here to tell you that you can do it that way if you have 3-5 years for your learning curve.

So, even if you think you cannot afford to purchase information I’m telling you that you cannot afford not to purchase information. Is that counter intuitive or what.

I’m not hyping you to obtain LCM I’m saying you should be obtaining something and never stop obtaining. Build yourself a trading library.

In fact. You should stay away from me. I want you to go and check out everybody else first. Then come back and see me. In that way you will appreciate that the free information I provide is more than you get when you obtain all these holy grail systems.

LCM IS NOT A SYSTEM. It is a method. And before you can understand what that really means you need to go out and try all those systems.

Just some food for thought in response to a couple of emails I received…


Cheers, Jerry
jerry@forextradingmajic.com
tradingmajic1@gmail.com


Monday, July 21, 2008

2nd post gbp/usd update


click to enlarge


If the close of the 1hr bar at 12:00 pm est does not close above today’s high of 9974 on higher volume than the previous 1hr bar it will be time for an early exit and reassess the market.

If we do close above 9974 on strong volume we can stay in the trade and move our stop to break even at 9952.

If you are not long here an opportunity for you to do so will come on a close above 9974 with volume parameters being met.

You can then place your stop below 9952. Profit targets have already been mentioned in the prior post.

Cheers, Jerry

gbp/usd update 7-21-08


Click to enlarge


Gbp/usd 7-21 08

Okay, the market closed down on the 1hr bar that closed at 9:00 am est. closed below daily support and 38% fib.

We now need to draw our intraday fib level to go with the daily fib level. The intraday fib is drawn inside the daily fib from the last intraday low to the last intraday high.

When we do this we can see that the last 1hr bar, even though a down bar, had lower volume that the previous 1hr bar.

So, this 1hr down move has not shown strength and therefore is not bearish to the 4hr bullish setup yet. So, far we have no trigger for a trade. Remember, Archimedes has shown us that a market can be falling and yet still be displaying strength.

Bar marked 1 on the chart is the current 1hr footstep and we can expect the range of this bar to be challenged and those short sellers should start buying to cover their positions which should provide a bounce up off intraday 61 or 78.6% fib.

The market is really waiting for the U.S. news data to come out at 10:00 am est. And it is typical for markets to go the other way to suck you in the wrong direction before the news comes out.

By the way, the current 4hr setup that we are looking at is an outside bar on higher volume. Until the market breaks below the low of the last 4hr bar the setup is still in effect.

AT the close of this bar I will be looking for an up close on lower volume to signal that selling pressure has been exhausted.

Always be suspicious when you see a long range bar as we had on the last hour but that last hour had lower volume.

There’s not enough time to say all I want as usual because I want to get this to you before the market moves. The setup at the close of this current bar at 10:00 am est just before the news will give a good indication as to which way price will go from here.

NOTE: If you were trading the Fibonacci technique outlined in the CHARTS AND MEN VIDEOS you would already have been short at the high of today.
Cheers,Jerry

SETUPS VS TRIGGERS

SETUPS AND TRIGGERS

You can learn all of the individual techniques you want but it still won't give you the market understanding that you really need. You can learn all the letters of the alphabet and still not know how to read.

You can learn to read words but still not understand what the words mean. You can learn all the notes to music but still not be able to read the sheet music of a musical score. You get my drift.

I teach not only the techniques but how to intergrate the techniques to fit your individual trading style.

There are only 2 types of moves

1. Pivots
2. Breakouts

These are the two reactions that propel a market from one s/r level to the next. This is where the ignition is turned on and the thrust initiated at these points carry price to the next s/r level via shear momentum. If we were in a rocket it would be called a short burst or “Burn”.

Where a burn is initiated at s/r, the direction and power will be in proportion to the amount of fuel/volume released to fuel the burn. Whatever system or method you are now using, it will be greatly enhanced by knowing the location of potential turning points and more importantly, what it means.

You have to understand that a setup is only meant to propel the market to the next s/r level. So, if price is moving down and you enter short near the next support level, the trade will most likely bounce up off support above your short entry price because you can easily expect a 20 pip bounce up off a s/r level even if price does recover and continue back down. If you are a day trader and that 20 pip bounce can easily turn to 40 or 50 if your broker smells the opportunity to stop you out.

This is the major problem of most traders. It is not direction that is the problem, it is timing. Timing is everything.
If you are right about direction but wrong about timing the market can go 150 pips against you before confirming that you were right about direction.

Timing is as much about where to enter/exit as to when to do so because, the WHERE tells you the WHEN.

At the where (s/r) you are looking for a particular chart formation to tell you that a directional move is imminent and this chart formation is called your SETUP.

The setup tells you that the market is set up or (balanced) to make a move either up or down. If the setup does not occur at a known s/r level the setup is still valid but has a much higher probability of failure than if this were not the case.

Now, before you enter a trade you want to have a TRIGGER. The SETUP cocks the gun…a confirmation of the SETUP is the TRIGGER. The trigger tells you it’s time to hit the enter button on your broker platform.

Your trigger is based upon an event you define, after the setup, to signal you to enter the trade. For example. My trigger to enter after the pivot or breakout setup in LCM is to enter on a pullback to the pivot point or breakout point.

Your setup determines direction but your trigger determines you risk by determining the exact location of entry and therefore the distance of your stop. Your stops and exits should also be determined by support and/or resistance.

Your trigger also determines your profit because the farther away from the next s/r level you can enter the more profit you have an opportunity to capture. If I go long I would rather enter 50 pips away from overhead resistance than 20.

In fact, if you don’t know the location of s/r you will end up going long 5 pips away from overhead resistance and then wonder why the trade went immediately against us.

Or we enter long and place our stop above support and wonder why we got stopped out and then price continued in our direction.

But if we get caught up in only TRIGGERS AND SETUPS yet, we don’t fully understand the importance of where the SETUP/TRIGGER occurs in the context of support/resistance you will never reach your trading potential.

Support and resistance reacts like the skin on a trampoline. When you hit it you will bounce. How high the bounce carries you is determined at WHERE? At the skin of the trampoline or support. It is the energy created upon the contact collision between you and support (skin of trampoline) at that precise point in time, that determines how high you will spring off the trampoline, or if the skin of the trampoline is strong enough to support the force of your fall without ripping and allowing you to continue falling down to the ground which is next support level. After that point you are carried upward by the momentum created by this initial explosion of energy or burst of upward force.

But what if there are other trampolines between the ground and the first trampoline? The odds are high that the next trampoline below the torn trampoline you fell through will most likely serve as next support against your fall stop your decent and spring you back up to the height near to test or back up through the trampoline you just broke through.

The trampoline you fell through is now above your head and will now serve as resistance to your rise on your bounce back up. Before you can continue upward you must first break through the membrane of the trampoline overhead. If you bounce back above and break back up through that first trampoline that could not support your fall, that first trampoline now once again becomes support for you when you fall back down to it so you can use that momentum to spring to the next trampoline above your head.

Now, when you are falling down to the trampoline don’t you brace or change the posture of your body to “SETUP” for the bounce off the trampoline. So, a setup is nothing more than market geometry and geometry is simply patterns, then the market geometry that is expressed on the chart can alert you to situations by the time and location of its geometry.

But what if you setup to brace yourself for the bounce? But what if someone snatched the trampoline from beneath you what would happen? Even though you were setup to bounce you did not bounce because there is no support for you to bounce off of.

Have you ever seen anything that bounced off of nothing? We know that for anything to bounce it must hit something right? So, if you see a setup and you do not see a s/r level, then you should be just as suspicious as if you so someone bounce off of an invisible trampoline.

You need to know the 6 types of support/resistance levels. A ceiling overhead or a floor below can be made of several different materials. It can be made of wood, ceiling tiles, brick, metal, etc… They are different but they all serve the same function. A ceiling can be made from a combinition of some of the construction materials together. This is called composite material. Support and resistance is a composite.

AS SUPPORT OR RESISTANCE…

A market is the same way. Support and resistance can be constructed of price, Fibonacci, moving averages, trendline, or volume s/r. IN TRUTH, s/r is composed of a composite material or combination of the different types of s/r. If you don’t know the six types of construction materials that s/r is made of then how can you know the blueprint or structure upon which the current s/r levels exist. S/R must hang upon a framework and knowing the framework/blueprints you will be able to find your way around the structure even in the dark.


Cheers, Jerry
jerry@forextradingmajic.com
tradingmajic1@gmail.com

Friday, July 18, 2008

EUR/USD UPDATE 7-18-08


I tried to post this at 11:57 pm eastern standard time last night but had trouble with the upload. We will look again later to see how the scenario outlined in the update has played out today.
I know my posts have been sporadic of late but I've been very busy producing many video lessons for 1 on 1 students and I just completed the new video reference section to go along with the book LAWS OF CHARTS AND MEN.
Todays video update gives you a taste of whats on the new vids, including trading the daily range and Fibonacci Majic. If you are trading off the 1 hr chartframe or lower I believe the info contained in the new videos about the daily range and Fibonacci is the most important information to your trading.
I should be finished with the production of all of the many new vids within the next few days and then the blog posts will become daily.
And remember, it's not just the techniques that you know but how to intergrate the various necessary components into a workable trading method.
Cheers, Jerry

Friday, June 13, 2008

EUR/USD 6-13-08


click to enlarge


We did get the 4hr bull pivot in the Eur/Usd off of professional buying but it did not come with the required volume I spoke of in the last insertion. We did However; reach the 50% Fibonacci level to 5477 off the insider buying which again shows the influence of professional buying.

So, once again we see the importance of volume to our trade setups. I did not trade this pivot because the pivot bar formed on lower volume and while this does not mean that price will not continue up but any move on low volume is suspect and thus the risk increases substantially for the setup to fail.

Insiders were buying on the pivot bar but could not get the public to join in on the move. But the public was in on the last 4hr bar which closed down on higher volume than the previous bar. I’m going to wait and see what shakes out because operators like to fade the public. I’m sorry; many traders don’t know the terminology of fading. That just means going the other way against the prevailing direction of the moment.

But understand with all that being said we won’t know if the market has reversed until the close of this current 4hr bar. Even though the bull pivot reversal came on low volume we still must consider that those who took price up in the first place (professionals) still have positions to protect at the low and we won’t know if we have a bear pivot back down until the close of this current bar.

Keep in mind that price is currently in the process of pulling back to test the pivot zone which is the range of bar 1 on the chart. So, let’s summarize the picture of the moment.

What is showing in favor of a downmove…?

The trend is down
Professionals have not yet shown up on this 4hr down turn. They however showed up as sellers on the 1hr at the 50% fib level but not in enough volume to negate the positions they are holding at the bottom

What is showing in favor of a continued move upward?

1. The market is testing the pivot zone which is where price is likely to bounce up from if it going to bounce
2. Professionals still have positions to support in the pivot zone.
3. Even though this bull pivot formed on low volume this downturn has yet to show the higher volume to negate it

If the bulls have low volume up and then the bears test the range with even lower volume down, then the bull have won the battle for volume supremacy. But we won’t know the outcome until the close of this 4hr bar.

So, this is the current picture…I will wait to see the outcome of the current bull/bear battle to see which side has the advantage.

Right now the biggest factor is the trend and the support line at 5440. If we close below 23% Fibonacci the downtrend has kicked back in. As I write this price is currently bouncing up off 23% fib level and we will look for a close above this level on low volume at the close of this bar to keep alive chances for a continued up move from here.
Especially since this fib level is at the support line to form double support of Fibonacci and price support.

Oh, by the way, support 2 has moved up to the last low before this current up swing at 5378.
But I hope you are starting to get an idea that volume analysis is critical to your long term trading success.

The way I see it at the moment we have a draw in the Euro Usd battle…

Cheers, Jerry
Tradingmajic1@gmail.com
jerry@forextradingmajic.com

Thursday, June 12, 2008

3rd update 6-12-08


click to enlarge

The last 4hr bar closed up above 5400 the upper range of support. But just as important that bar was supported by operator accumulation and accumulation at this support level is also evidenced by operator/professional buying on the 1hr whenever we touch this support level.

A close above next resistance on higher volume would signal a 4hr bull pivot above support. If this happens a long trade should be your bias as you will have the pivot support as well as operator support beneath longs in that area.

Bar 1 on the chart was a volume divergence at support to signal that the bears lost control there. It was a high volume battle to a draw between bulls and bears, so this is our key bar on the way up especially since the high of that bar coincides with overhead resistance. If we break above the high of this bar price should continue up to 62% Fibonacci drawn from the top of the last down move to the last bottom.

If you want to try to get in early and lower your stop level you can enter long on a pullback to the close of bar 1 on the chart 5432 with your stop 6 pips below the low of bar 1. But be advised that this is a higher risk strategy because no pivot support has been developed yet. If you want to try it only take half of your normal position here and add to your position on the formation of the possible bull pivot spoken about above.

That’s all for now, I’ve been up all night so I gotta take a little nap.


Jerry
tradingmajic1@gmail.com
jerry@forextradingmajic.com

2nd update -eur/usd 6-12-08


click to enlarge


For my students who probably knew better than I did and spotted the 4hr bear pivot on the 4hr let’s talk about that bear pivot reversal bar. Now, you are saying that the pivot bar formed on lower volume so why did price continue down.

And that question allows me to segue into the new videos I have been producing to augment the principles outlined in your book, Volume-The Archimedes principle.

I’m going to mention the market facilitator index (MFI). The MFI tells you who is doing the buying and selling. For example on the pivot bar the MFI is blue. When the bar is blue it means that professionals moved that bar. A.K.A. Operators.

So even though this pivot bar had lower volume it is more important who generated the volume. If operators move the market in a given direction they are going to protect their position. So here they are going to protect their shorts down to the next support level.
And you want to trade with them not against them.

When the next bar after the pivot bar closed lower on higher volume the momentum was sealed and the herd then jumped in as evidenced by the green MFI BAR. When you see a green MFI bar,that means public participation is moving that bar A.K.A. THE HERD… operators fade the herd.

I know this stuff is in the book but volume can be kind of tricky and hence the new videos to compliment the book. Anyone who has ever bought THE ARCHIMEDES PRINCIPLE will get the videos free.

I have sent to your mailbox a free ebook about volume. No I did not write it but, it will help you understand why volume is so important. They give free downloads of the book to introduce you to a software program that they say will interpret volume for you automatically. I have no affiliation to them whatsoever. A friend directed me to their book I thought, “Wow, they are selling this software for $1100 dollars to do the very same things I teach in The Archimedes principle. I don’t know if their software works but I know that I actually teach you how to use volume and with plenty of chat examples and now the videos.

Jerry

eur/usd


click to enlarge
Okay, for those who did not take the 21 pip stop on the eur/usd alert I think I was able to stuble upon the right chart this time...
we have broken through the support low of 5440 and if we close below that level on this 4hr bar on higher volume than the last bar the trend is still down. After the close of this bar price should pull back up to 5440 and then you should switch your long to short.
The next support low is at 5365. exit your long on a pullback to 5440 and switch your position to short and ride it down to 5365. Any time you enter a trade you want to get out if price falls below the most recent low for a long trade or most recent high for a short trade.
Most short sellers have their entry limit orders just below the low and this selling volume there accelerates a downward move. When price comes back up to the broken low, all those longs who are in the red start selling out to break even and thats why you should too because that selling volume waiting there will cause price to at least bounce back down before price will continue up. if price does not close below 5440 you are still in business.
Cheers, or should I say, FEARS...
Jerry

Wednesday, June 11, 2008

USD/CHF 6-11-08


Click to enlarge


On the usd/chf we have a bear pivot on the 4hr. I have noted the swing bar (S) and the pivot reversal bar (P) on higher volume.

Okay, our pivot point is the low of our swing bar at 1.0409 and this is our trigger (entry) point for the short trade here.

But I also want you to look at the blue line that price is currently bouncing up off of at 1.0389. Why is price bouncing up off of this level? That is because bar (x) is first level of psychological support below the most recent high.

Thus we undoubtedly should expect those short sellers to be buying back to close out. After all when price went above this bar (x) they are then in the position of waiting for price to come back to their entry point to break even.

The entire length of bar x is support to stall any continued down move. Now, look at bar (z). Bar z is a range bar so those of you who have lcm know what to expect. The bottom range of the range bar is support.

To summarize we have a directional signal, and once again those with lcm know the difference between a directional signal and an entry signal. The directional signal is down but we don’t have an entry signal until price rises to the pivot point and gives us our short signal in that area on our 5 or 15 min chart.

You see, when you have a directional signal that only give you direction but what about the timing of your entry. Direction is easy timing is not. Your timing determines whether you can stay in a trade if you’re right because your stop level can be in line with your risk/reward parameters.

So anytime you have a level where you plan to enter, just because price touches that level doesn’t mean it’s time to enter. Price must hit you level and then meet certain conditions. If your conditions are not met at your entry level then you must ignore the entry.

So, now lcm-ers, anytime you have a pivot and that pivot bar also hits s/r to bounce back towards the pivot caution is advised especially if the pivot is counter trend as we do here.

Therefore this is the way I am playing this pivot. I will look to enter on a 5 or 15 min signal somewhere within the range of the pivot bar (p) between1.0409 and 1.0423. Getting that signal I will enter and place my mental stop above the swing bar (s) above 1.0446. I will look to take profit at 1.0366 which is the open of the range bar.

Remember no 5 or 15 min signal within the entry zone means no trade is signaled. For those who can’t watch the 5 and 15 you can just place your limit order with the numbers above. There is nothing you can do about it. There is nothing wrong with it, but the technique above will help keep us out those rare times we are off base.

With all that being said the market may fool around until the crude oil inventories report comes out at 10:30 est. Oil is considered the new gold and has attached itself to the dollar as far as correlation. So, baring any surprise news announcements between now and then we may not see much action because I don’t see any catalyst (news) to get the herd in motion except for news coming out of Canada and the usd/cad seems to trade within it’s own world but since nothing else is on the horizon until the oil inventories the market may make due with that in the interim.

Cheers, Jerry

Tradingmajic1@gmail.com
jerry@forextradingmajic.com

Tuesday, June 10, 2008

gbp/usd update 6-10-08


click to enlarge
This post is a reprint of the email sent out yesterday, Mon, June 9, 2008 1:20 pm.
okay, on the gbp/usd 4hr we are closing with a bear pivot below friday's high, with the necessary higher volume.Now, what we must consider first is the intraday trend and that trend iscurrently up. so our bias must still be up based on the current chartpattern even though price is falling. Any healty move will pullback beforeattempting to continue unless it is news related and that is more emotionthan true move, the news that is.

The last bar reached the support bar which is bar 1. The low of bar z isthe pivot point and this is where we can enter short with a stop above thehigh of bar z and our target the low of bar combining our outside barguidelines with our footstep guidelines. To be safe I would take profitat the open price of bar 1 just to avoid potential operater intervention.

Also, even though the low of bar z is the pivot point i would enter at theclosing price of bar z because this would be a counter trend trade.Counter trend trades are always riskerier and we really should not betrading against the trend but if we're going to do it this is how you doit.

I would enter short at 9767 with a mental stop above 9800 and a target of9698. That's if I was going to execute a counter trend trade. Since it iscounter trend I would drop down to my 5 min when price reached my entryprice and only enter there if i get a 5 min confirming signal.

The really great signal for a short is a 4hr close below the low of bar 1because then there will be plenty of overhead resistance to knock priceback down if it should attempt to move back up.
cheers, jerry